Organizations don’t lack data. It is continuously produced by the various systems used by the organization. But how much of it is left unused because
- data from different sources are located in different systems and in different formats and are difficult or even impossible to combine,
- there is so much data that it is difficult to distinguish useful information from it,
- the existence of the data is not known to those who could use it.
Today, almost all systems in use and the devices connected to them, such as smart cameras, produce a wide range of data. Objects such as cars, motorcycles, people and animals can be identified. Directions of travel, locations, number plates, etc. can be recognized. Video management, access control, intruder alarm and fire systems provide data to secure people and premises. The limited information available from each device and system can often be utilized locally, system-specifically and thus narrowly.
Data becomes much more useful when you are able to combine information generated by all devices and systems, not just at a single site but across all sites. Filtering the data with different criteria and clearly visualizing the obtained information makes it possible to utilize the information in decision-making in a new way. At the same time, the data generated by the systems and devices can be used to automate processes and make operational and strategic reporting information available to the organization in the required format for various uses.
For example, where you would use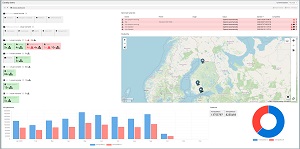
- site-specific actual data on existing system and device failures or top 10 failure situations over the past month; or
- people counting data on the number of visitors at each site as a function of time, specified even by door and space.
Dashboards as an integral part of data utilization
Data utilization is facilitated by various individual smart dashboards. In addition to individuality, customizability, and versatility, the essential features of the dashboard are real-time, interactivity, and ease of visualizing data.
The interactive dashboard is able to drill from annual entities down to minute-level details, or from the group level to single-site figures, in real time. With the help of dashboards, the same data can be presented in a visually informative way from several perspectives.
In the real-time dashboard, the data is updated in the background all the time. So you can update one or all of the components of the dashboard you are using, depending on your situation. The database in use also makes it possible to retrieve historical information. This allows you to make comparisons between different time periods, search for development trends or look for cause-and-effect relationships, for example.
Versatility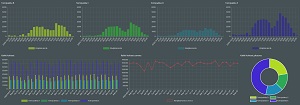
With the dashboard, you can easily combine different components into a functional data bank for decision making. As needed, in the same dashboard, you list things, highlight a single piece of content as well as different combinations of several different pieces of content, use graphics in visualization (line, bar, circle, and radial charts), and illustrate with maps and floor plans.
There is no need to limit the number of dashboards, so if needed you can have several different dashboards in your use. You just select the grid template you want and the component you want for each “box”, and you have a new dashboard base at your disposal.
Easiness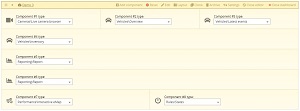
Active utilization of information requires easy access to dashboards on both mobile and office computers. Data can also be exported to other systems such as Excel.
Sharing information with others
A versatile user rights management allows access to the necessary information at different levels of the organization, both horizontally and vertically. Not everyone who needs to be provided with information needs to manage their own dashboards to get the information. Dashboards and reports can be shared with colleagues. Sharing can be automated for the defined recipients at specified times.
Dashboards and reports can also be shared on monitor screens - all with the same content or different content - when you want to share information, for example, by department or location.